What real-time email analytics actually tells you
A campaign feels abstract while it is sending. A live email analytics dashboard turns that activity into a timeline you can understand: how many messages left the queue, how many were accepted, which links attracted attention, and whether an unusual failure pattern needs investigation.
Real time does not mean every number is perfect or literally instantaneous. Delivery events usually arrive quickly, while opens and clicks depend on tracking technologies, recipient devices, security filters, and network delays. The useful goal is timely direction—not a false promise that every human action can be measured with certainty.
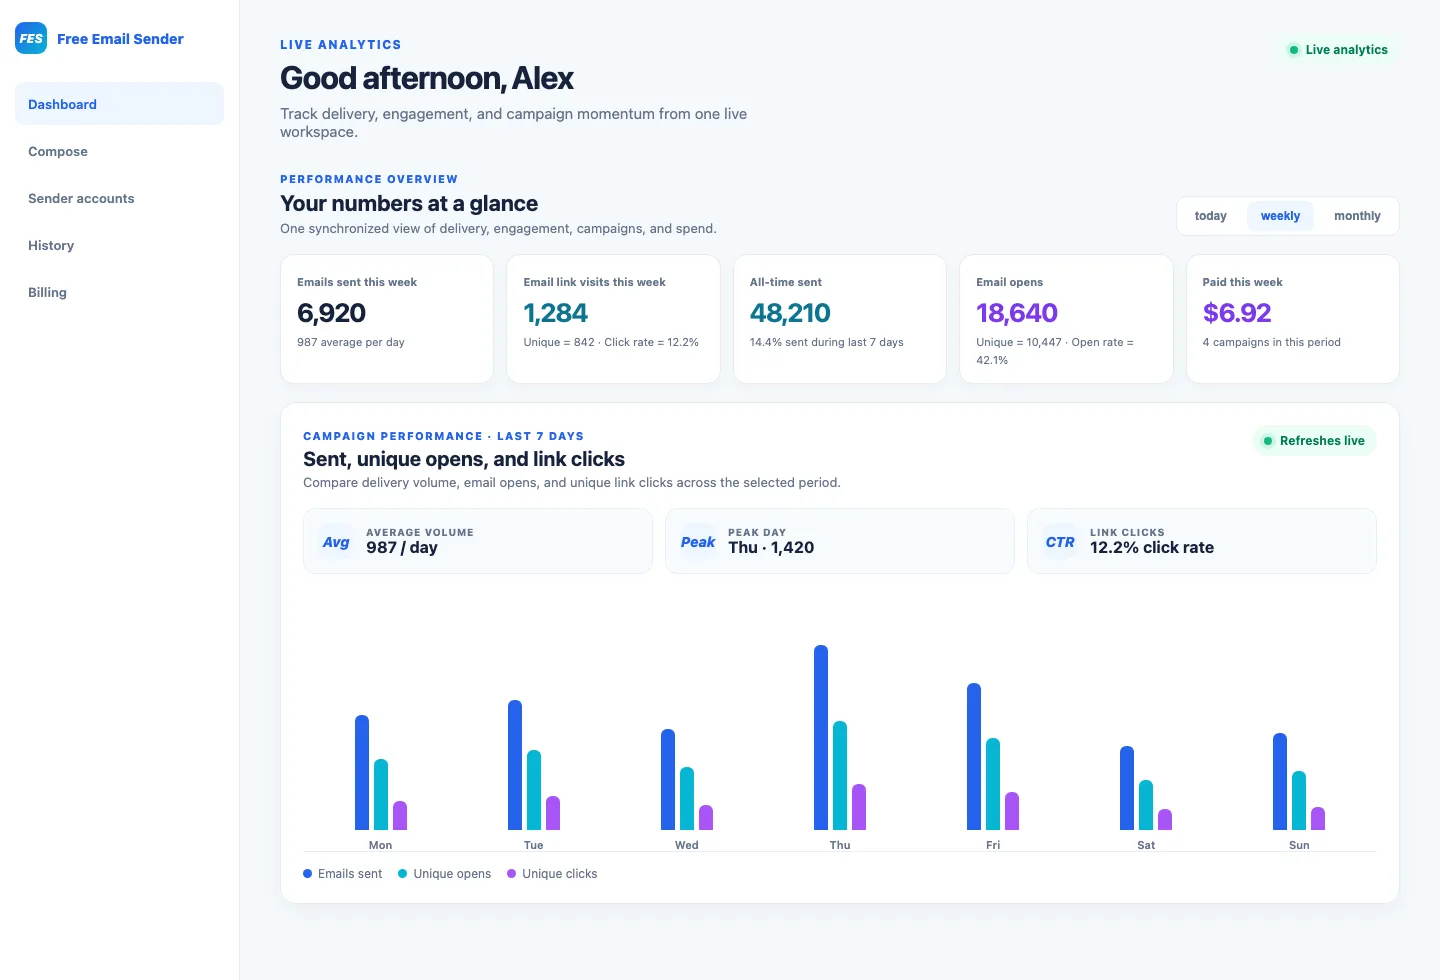
Start with emails sent today, this week and this month
The clearest account overview uses three familiar windows. “Today” helps an operator watch an active campaign. “This week” reveals short-term pacing and workload. “This month” provides enough context for planning capacity, comparing performance, and checking whether sending volume remains within a provider or account allowance.
Use one documented timezone for every total. Without that rule, a campaign sent near midnight can appear in different days for different team members. The dashboard should also define whether “sent” means handed to an SMTP server, accepted by the receiving server, or confirmed as delivered.
- Today: operational monitoring and rapid error detection.
- This week: recent trend comparison and campaign pacing.
- This month: capacity, budget and longer-term performance review.
- Custom range: investigation around a launch, promotion or incident.
Build a trustworthy delivery funnel
A large sent number looks encouraging, but it is only one stage of the message lifecycle. Read the funnel in order: queued, sent, delivered, temporarily deferred, permanently failed, opened and clicked. A gap near the top of the funnel can explain weak engagement further down.
Keep event definitions visible beside the report. For example, an SMTP-accepted message is not proof of primary-inbox placement. A permanent failure should be suppressed rather than retried indefinitely, while a temporary deferral may justify slower pacing or a later retry.
- Sent rate = sent messages ÷ attempted messages × 100.
- Delivery rate = delivered messages ÷ sent messages × 100.
- Failure rate = permanent failures ÷ attempted messages × 100.
- Complaint and unsubscribe rates should be monitored alongside volume.
How email open tracking works—and where it misleads
Most open reporting relies on a tiny image that loads when the email is displayed. A unique open normally counts a recipient once, even if the tracking image loads several times. That makes unique opens more useful than total opens for estimating audience reach.
The number remains an estimate. Image blocking can hide a real read, while privacy protection and automated security systems can preload an image without a person reading the message. Compare open trends across similar campaigns, but do not use opens alone to judge an individual recipient or a campaign’s business value.
Track link clicks, unique visitors and the links people chose
Click reporting is closer to intent because a recipient has interacted with a call to action, product, document or navigation link. A useful report separates total clicks from unique clickers and shows each destination URL. This answers two different questions: how much activity occurred, and how many people participated?
Link-level reporting can reveal that readers preferred a pricing page over a product tour, or a practical guide over a promotional offer. Preserve campaign parameters on the destination URL so website analytics can connect the click with later actions such as registration or purchase.
- Click-through rate = unique clickers ÷ delivered messages × 100.
- Click-to-open rate = unique clickers ÷ unique opens × 100.
- Top clicked link identifies the strongest destination in the message.
- Downstream conversion confirms whether the visit produced a useful result.
Where was an email link visited?
A tracked click can be associated with an approximate country, region or city by looking up the network address that requested the redirect. A geographic report can help teams compare regional interest, choose sensible send times, localize landing pages, or notice unexpected traffic.
Location is approximate, not a person’s exact physical position. Corporate gateways, mobile networks, VPNs, privacy relays and security scanners can make a click appear far from the recipient. Country-level trends are generally safer to interpret than precise city claims, especially when the sample is small.
- Show country or broad region before city-level detail.
- Label unknown and privacy-relayed traffic instead of guessing.
- Apply minimum sample sizes before presenting percentages.
- Do not use approximate location to make sensitive decisions about individuals.
Filter bots and automated security visits
Business email gateways often inspect links before delivering a message. That scan can look like a click even though the recipient never touched the email. Some systems also fetch several links within seconds from the same network address.
A responsible analytics pipeline marks suspicious patterns, preserves the raw event for troubleshooting, and excludes likely automated activity from human-engagement summaries. No filter is flawless, so dashboards should describe whether reported clicks are raw, filtered or verified by a later website session.
A practical real-time dashboard layout
Put the decisions people make most often near the top. Begin with compact cards for sent, delivered, unique opens, unique clickers and failures. Follow those cards with a time-series chart, then provide campaign, link, device and location breakdowns. Users should be able to move from an account-wide trend to one campaign and finally to a specific event without losing the selected date range.
Avoid filling the screen with decorative numbers. Every metric should answer a practical question, explain its denominator, and lead to an action. A sudden failure increase might prompt a list or SMTP review; a high-click link could inform the next campaign; a regional pattern might justify a localized landing page.
- Summary cards for today, seven days and 30 days.
- Hourly or daily sent, delivered, open and click trends.
- Campaign comparison using the same metric definitions.
- Top links with unique clicks and downstream conversions.
- Country and region breakdown with an “unknown” category.
- Exportable event records for investigation and reporting.
What leading email analytics platforms emphasize
A review of current reporting pages from MailerLogic, Mumara ONE, MailerLite, Transmit and TrueSend shows a consistent baseline: sent and delivery status, opens, clicks, bounces, unsubscribes and time-based trends. Several products go further with per-message event histories, device or provider breakdowns, bot filtering, geographic reports, revenue attribution and analytics APIs.
The competitive lesson is not to copy every chart. Strong products connect three levels of detail: an account overview for today, week and month; a campaign report for content and audience decisions; and an event trail for diagnosing one recipient or delivery problem. Clear definitions and honest limitations can be more valuable than a dashboard with dozens of unexplained metrics.
Turn live numbers into better campaign decisions
Check the dashboard with a question in mind. During a send, watch processing pace and failures. After the first meaningful sample arrives, compare links and audience segments. At the end of the week or month, look for repeated patterns rather than reacting to one campaign.
A good review produces one or two changes: clean a poor-quality source, clarify the main call to action, adjust timing for a regional audience, or fix a landing page that receives clicks but few conversions. Analytics earns its place when it improves the next recipient experience.
Privacy, consent and responsible data retention
Open, click, device and location events may be personal data depending on the jurisdiction and context. Explain tracking in an accessible privacy notice, collect only what has a defined purpose, limit access, set retention periods and honor applicable consent or objection rights.
Do not hide invasive tracking behind vague language. If a useful decision can be made from aggregated country-level trends, there may be no reason to retain a detailed network address. Review requirements with qualified counsel and current guidance from the relevant regulator.
Real-time email analytics checklist
Before trusting a dashboard, verify that its dates, event definitions, denominators and filters are consistent. Then make the limitations visible to every person who uses the report. Honest measurement creates better decisions than artificially precise numbers.
- Define sent, delivered, opened and clicked in plain language.
- Use a consistent timezone and date boundary.
- Separate total events from unique recipients.
- Filter likely bots and label the filtering method.
- Treat open and geographic data as estimates.
- Connect clicks with meaningful website outcomes.
- Protect personal data and document retention.
Frequently asked questions
Can I see how many emails were sent today, this week and this month?
Yes. An email analytics dashboard can aggregate send events into daily, seven-day and monthly totals. Use a consistent timezone and confirm whether the platform defines sent as SMTP accepted or delivered.
Can email analytics show who opened an email?
Open tracking can estimate when a recipient’s email client loaded a tracking image, but image blocking, privacy protection and automated systems mean it is not definitive proof that a person read the message.
How do I track which link was clicked in an email?
Tracked links pass through a redirect that records the campaign, recipient or anonymous identifier, destination and time before sending the visitor to the intended page. Reports should separate total clicks from unique clickers.
Can email click tracking show the visitor’s location?
It can estimate country, region or city from network information, but VPNs, mobile networks, corporate gateways and privacy relays reduce accuracy. Treat location as an approximate trend rather than an exact physical position.
What are the most important email campaign analytics?
Start with attempted, sent, delivered, permanently failed, complaints and unsubscribes. Add unique opens as a directional signal, unique clicks for engagement, and conversions for the campaign’s actual objective.
Sources and further reading
Related Free Email Sender guides and official product, pricing, policy, or methodology pages reviewed for this article. Features and prices can change, so confirm current terms before making a decision.